Data science and ML
A Monte Carlo engine that estimates oil in place from uncertain inputs. It runs entirely in your browser, and every result can be shared as a link that reproduces it exactly.
Live at poros.sintim.studioPhase 1 completeRuns in your browser
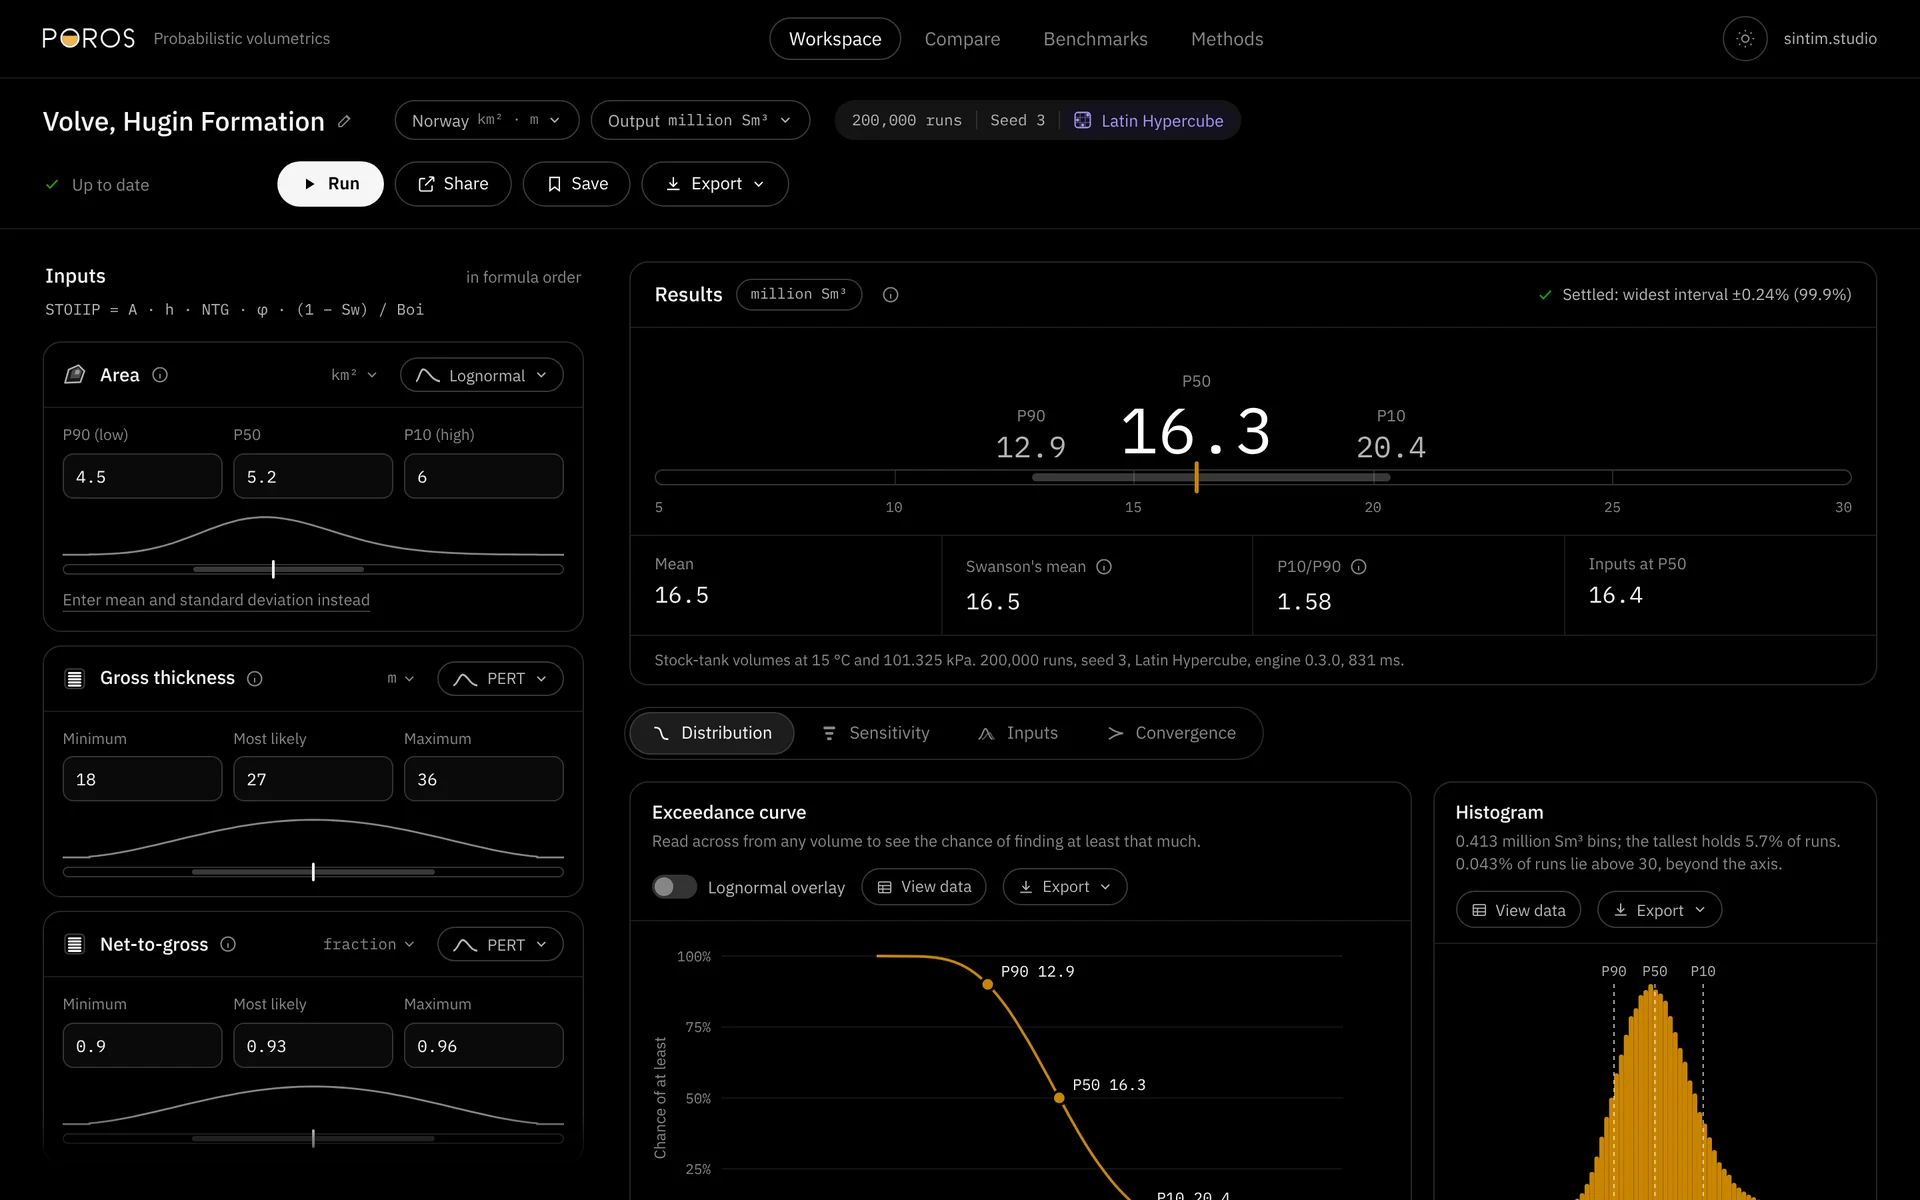
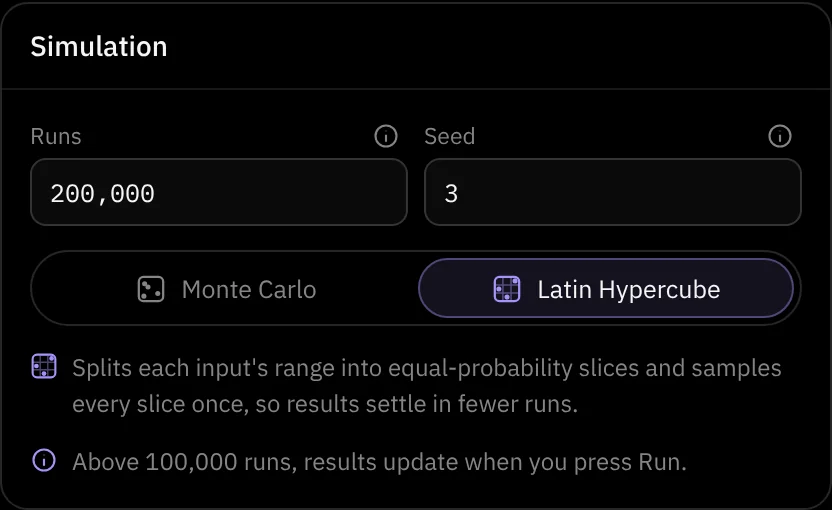
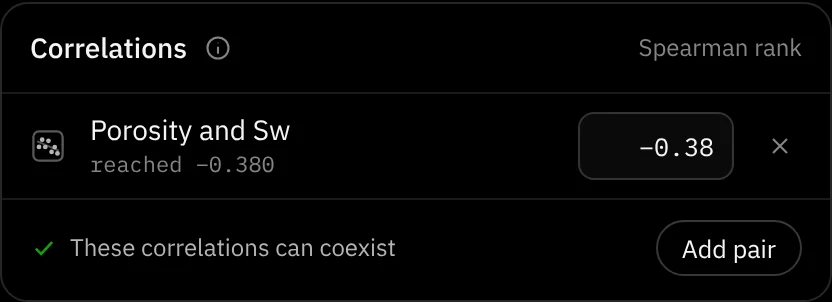
// The workspace, open on the Volve field
- Engine
- Monte CarloLatin Hypercube sampling, inputs correlated by rank
- Built with
- TypeScript, React, Next.js, D3 and Web Workers, tested with Vitest, Playwright and axe-core
- Tested
- 392 tests247 on the engine, 145 on the app
- Status
- Phase 1 livePhase 2 planned
Why it exists
Put a number
on the uncertainty.
Poros began as a Python desktop app I wrote for a course assessment. Looking back at it, it fell short in ways that mattered: it let inputs drift into physically unrealistic values, and it forced a bell curve onto a lopsided result, which put the low case in the wrong place.
So I kept the script as a reference and built Poros from scratch: a simulation engine with bounded distributions, correlated sampling, sensitivity analysis and convergence checks, running entirely in the browser. One rule held throughout: nothing counted as done until a test proved it.
Inputs that stay physical
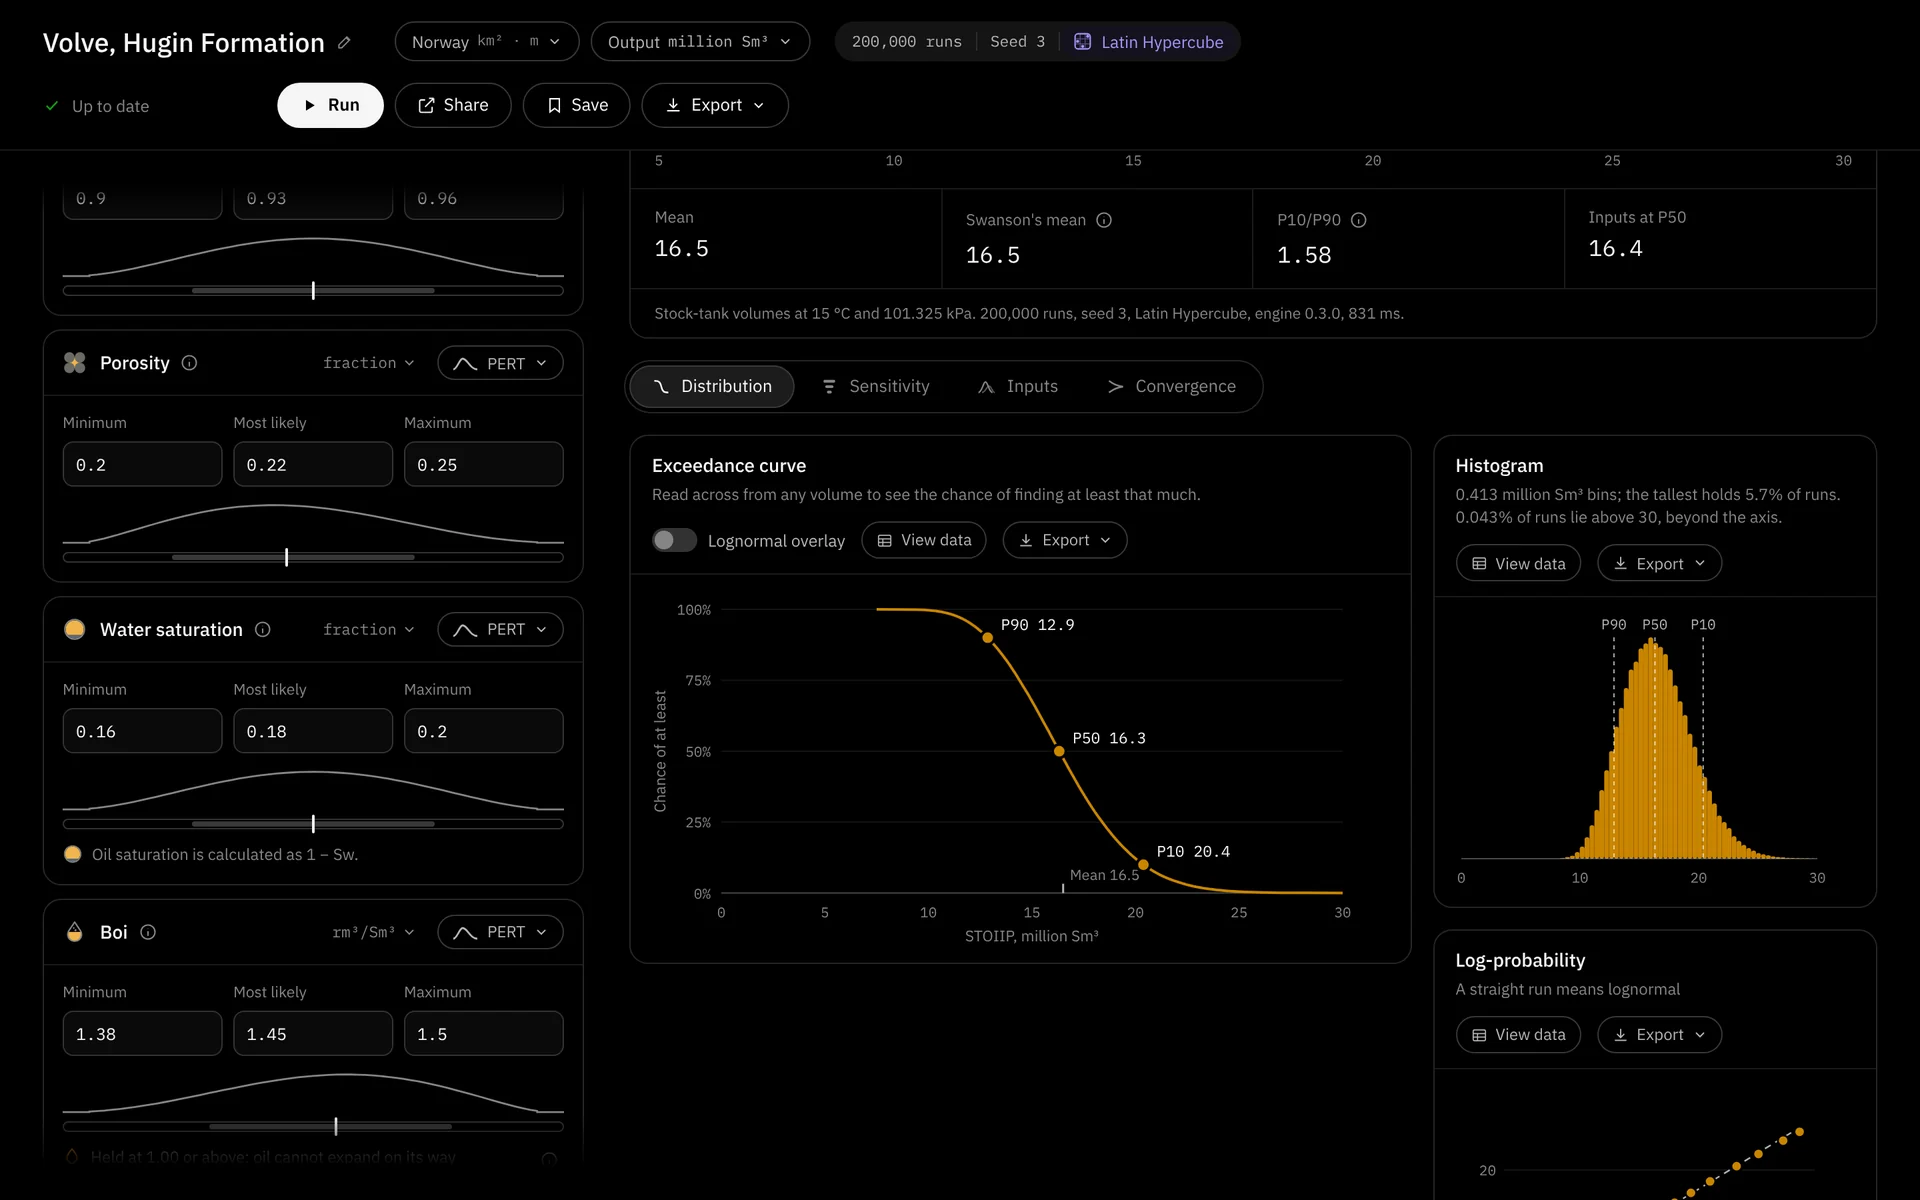
Every input is sampled inside its physical limits, however wide a range you give it.
Inputs that move together
Porosity, net-to-gross and water saturation come from the same logs, so Poros lets you correlate them, and each keeps its exact distribution.
The answer as a curve
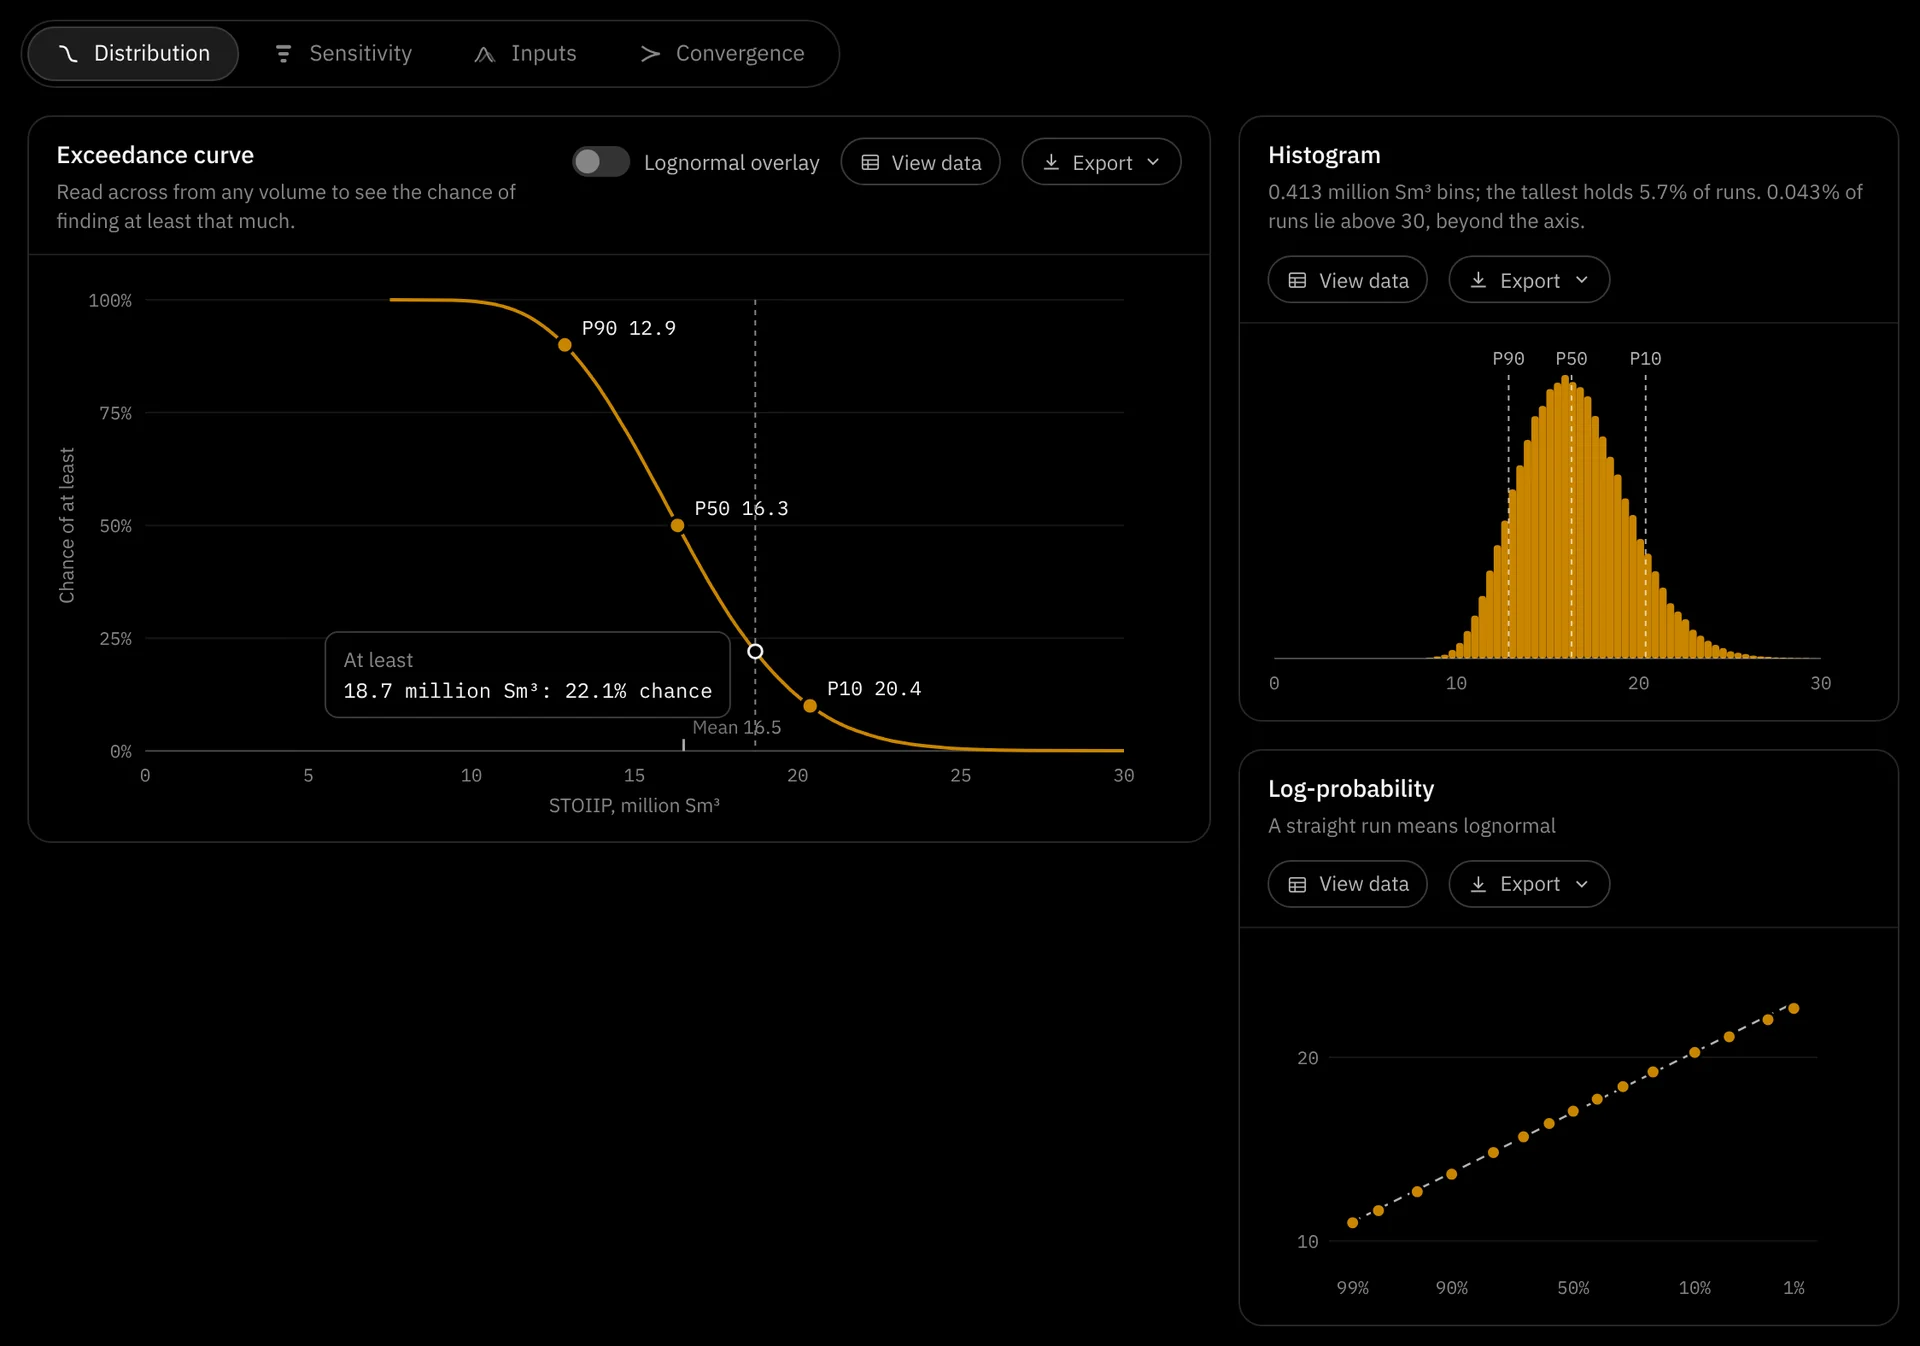
Oil in place multiplies its inputs, so the answer is lopsided. Poros reads the low, middle and high cases straight off the results.
How it works
Ranges in,
evidence out.
// 01
Describe the uncertainty
Each input is a distribution, entered as a low, best and high case, or as a minimum, most likely and maximum. A live curve shows its shape, with the physical limits shaded.
// 02
Read the answer
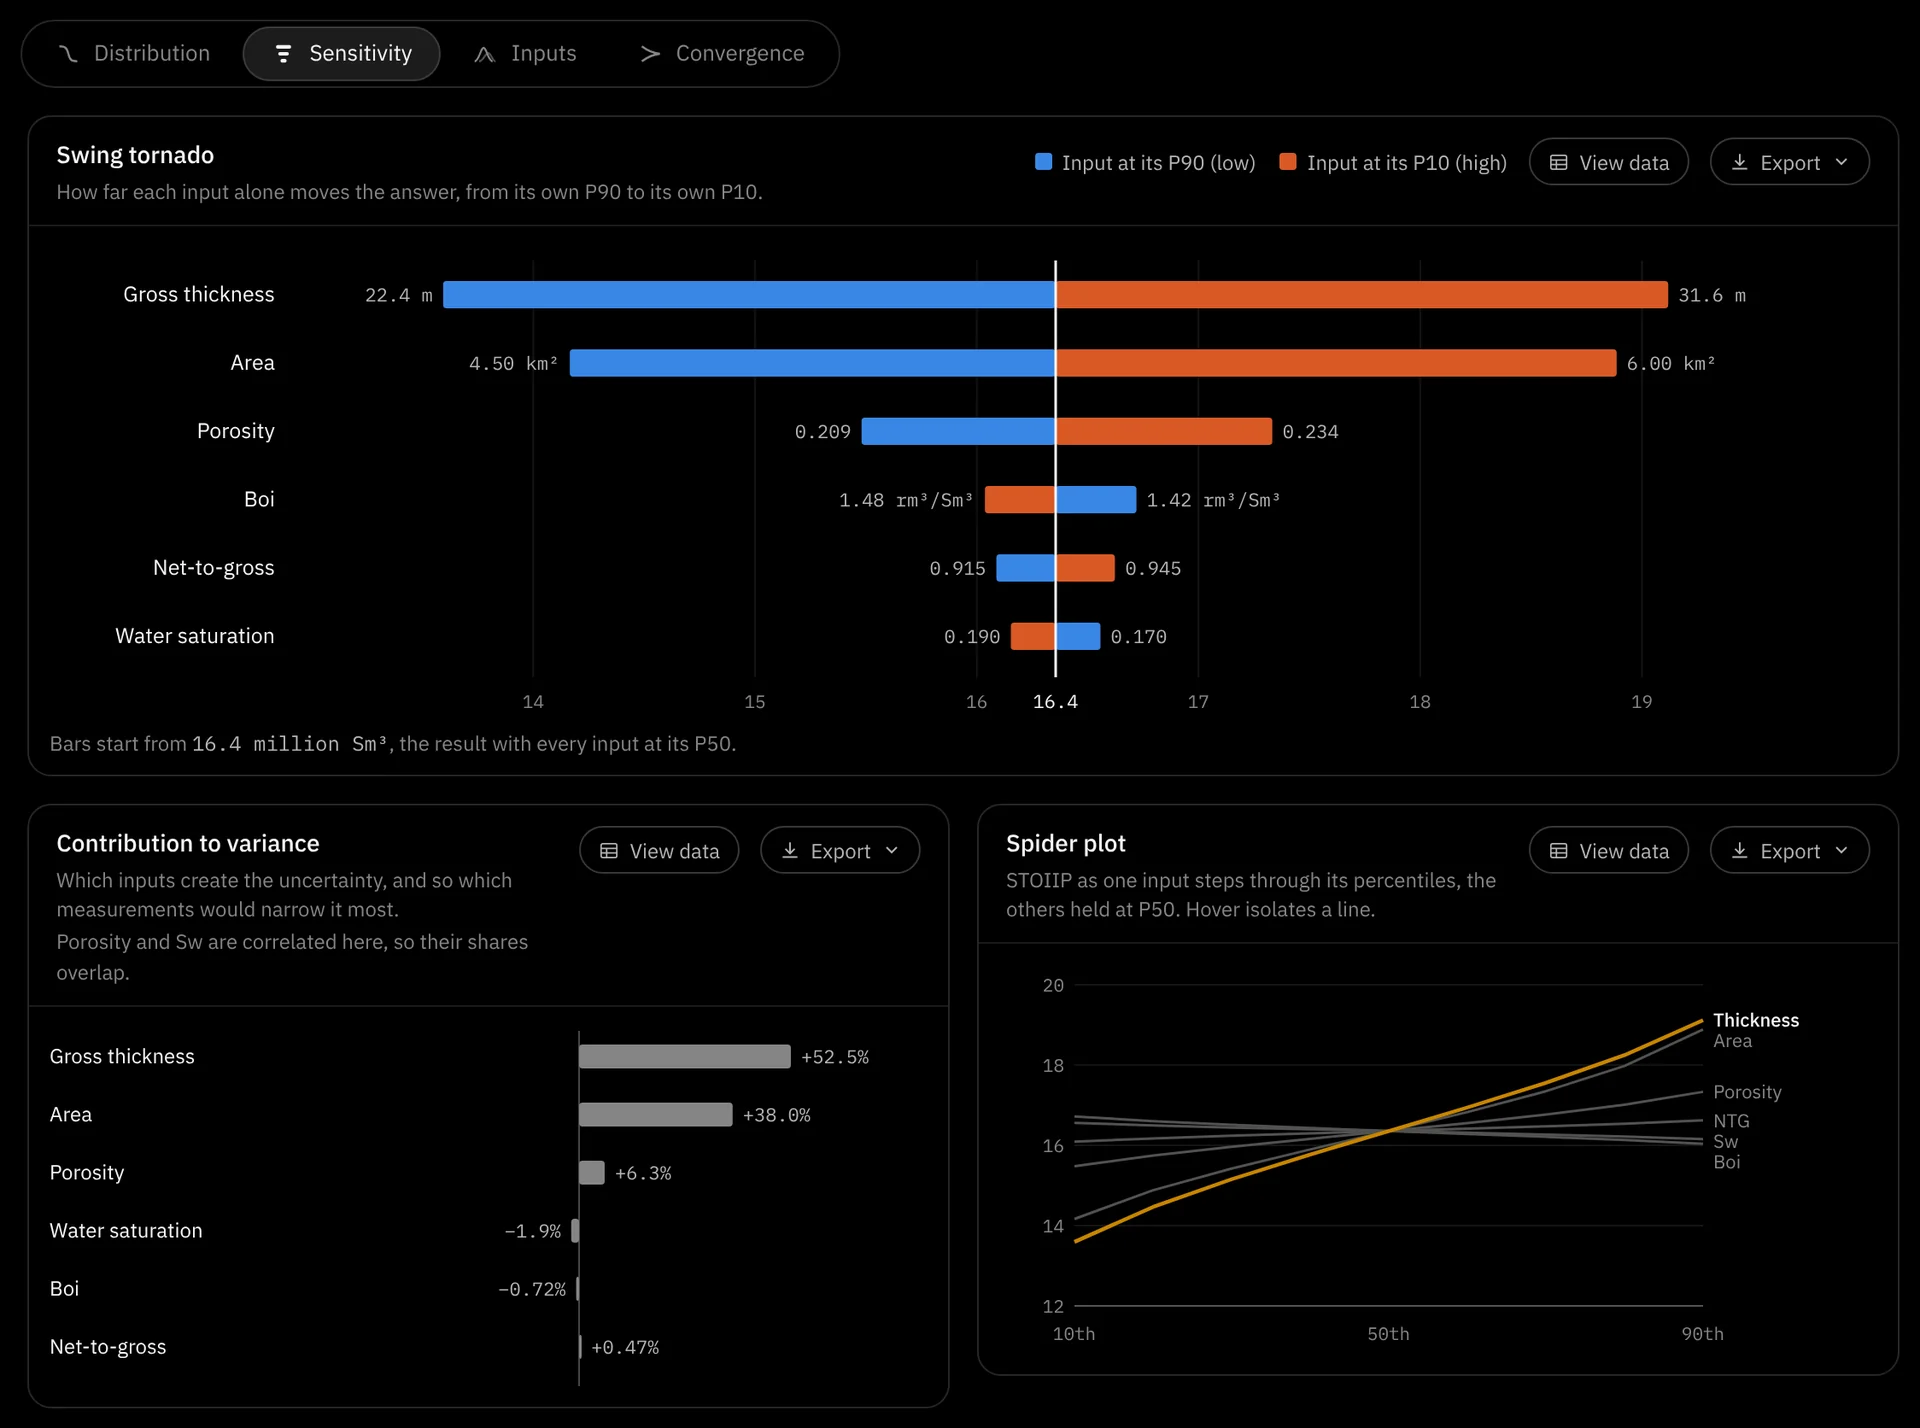
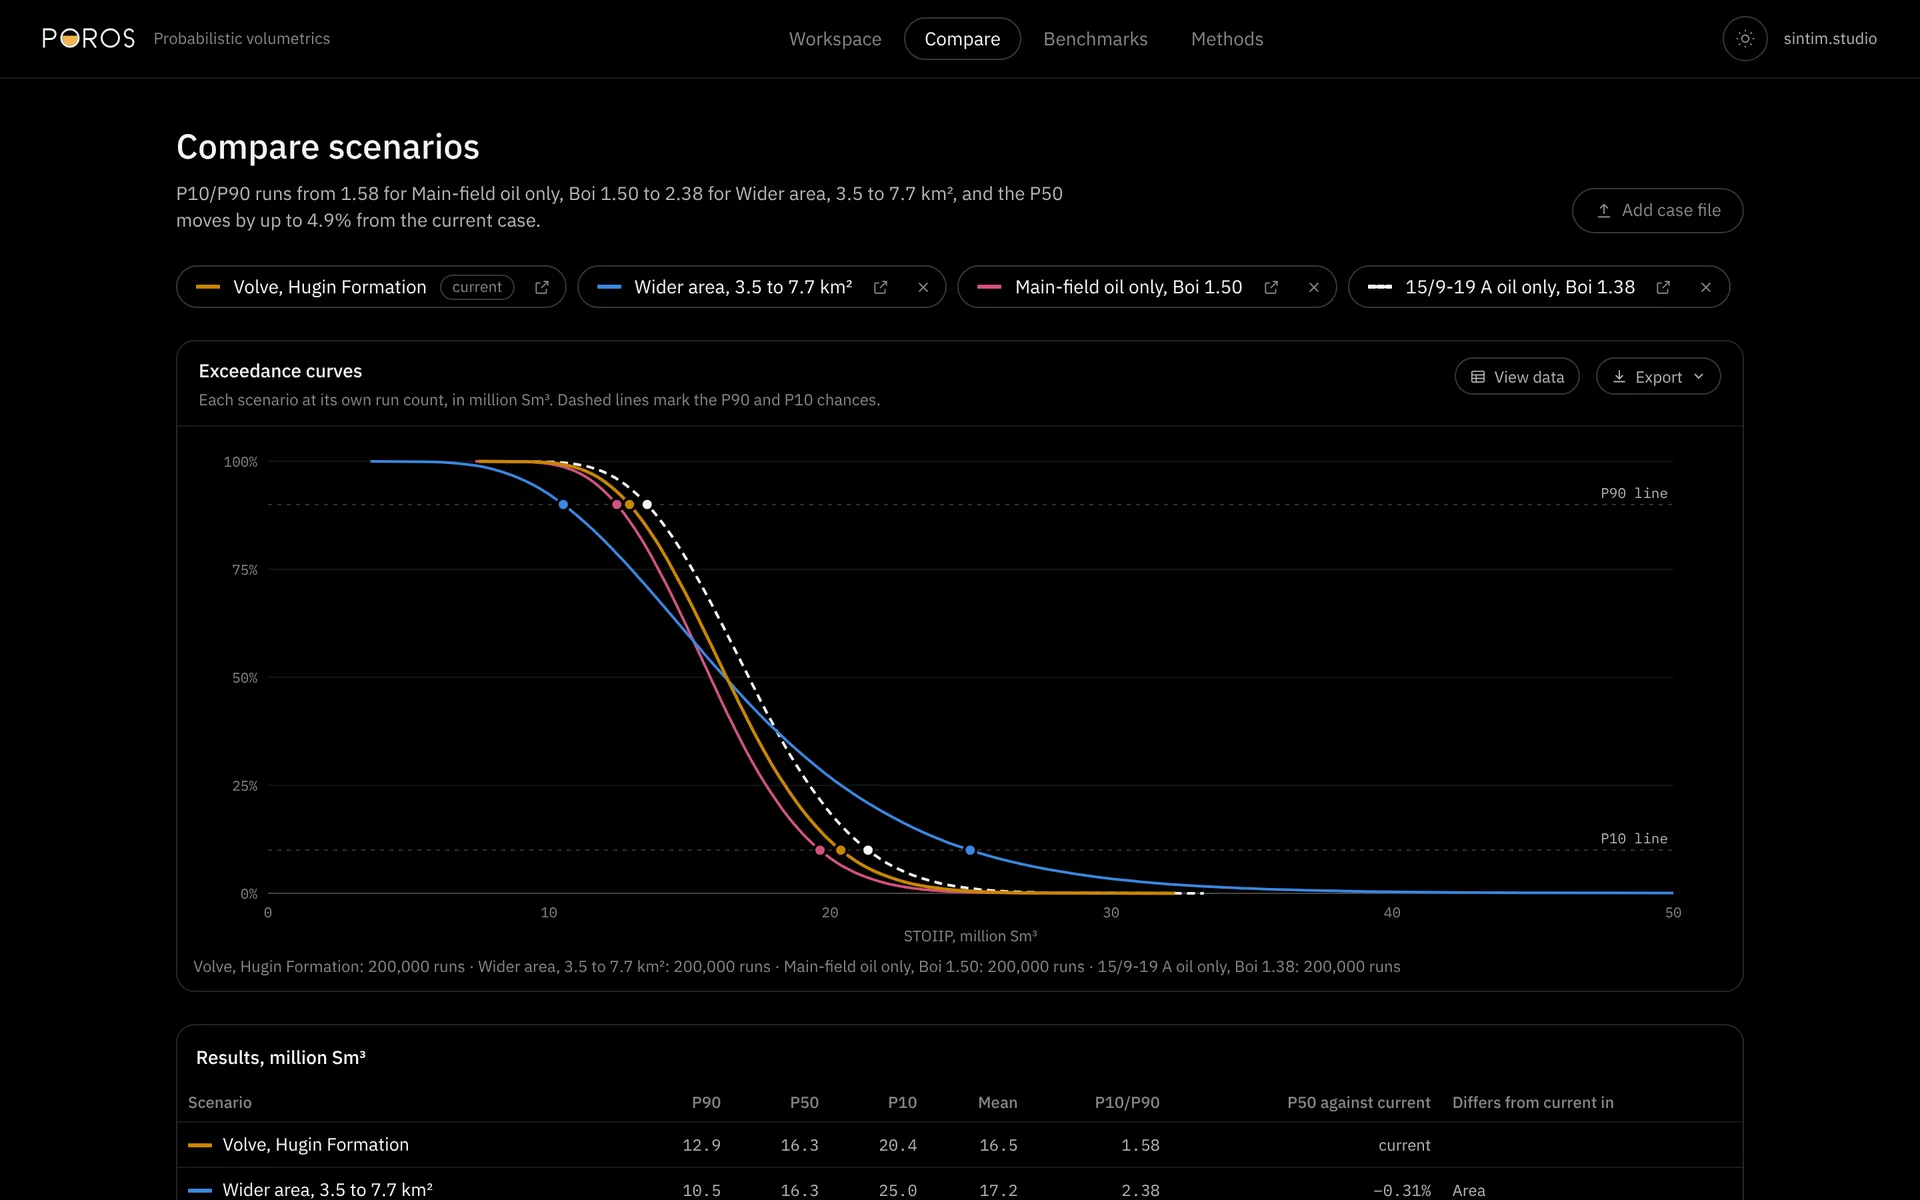
Hundreds of thousands of runs settle into a low, middle and high case (P90, P50 and P10) on one curve. The Sensitivity tab shows which inputs drive the spread; on Volve, it's thickness and area.
// 03
Know when to trust it
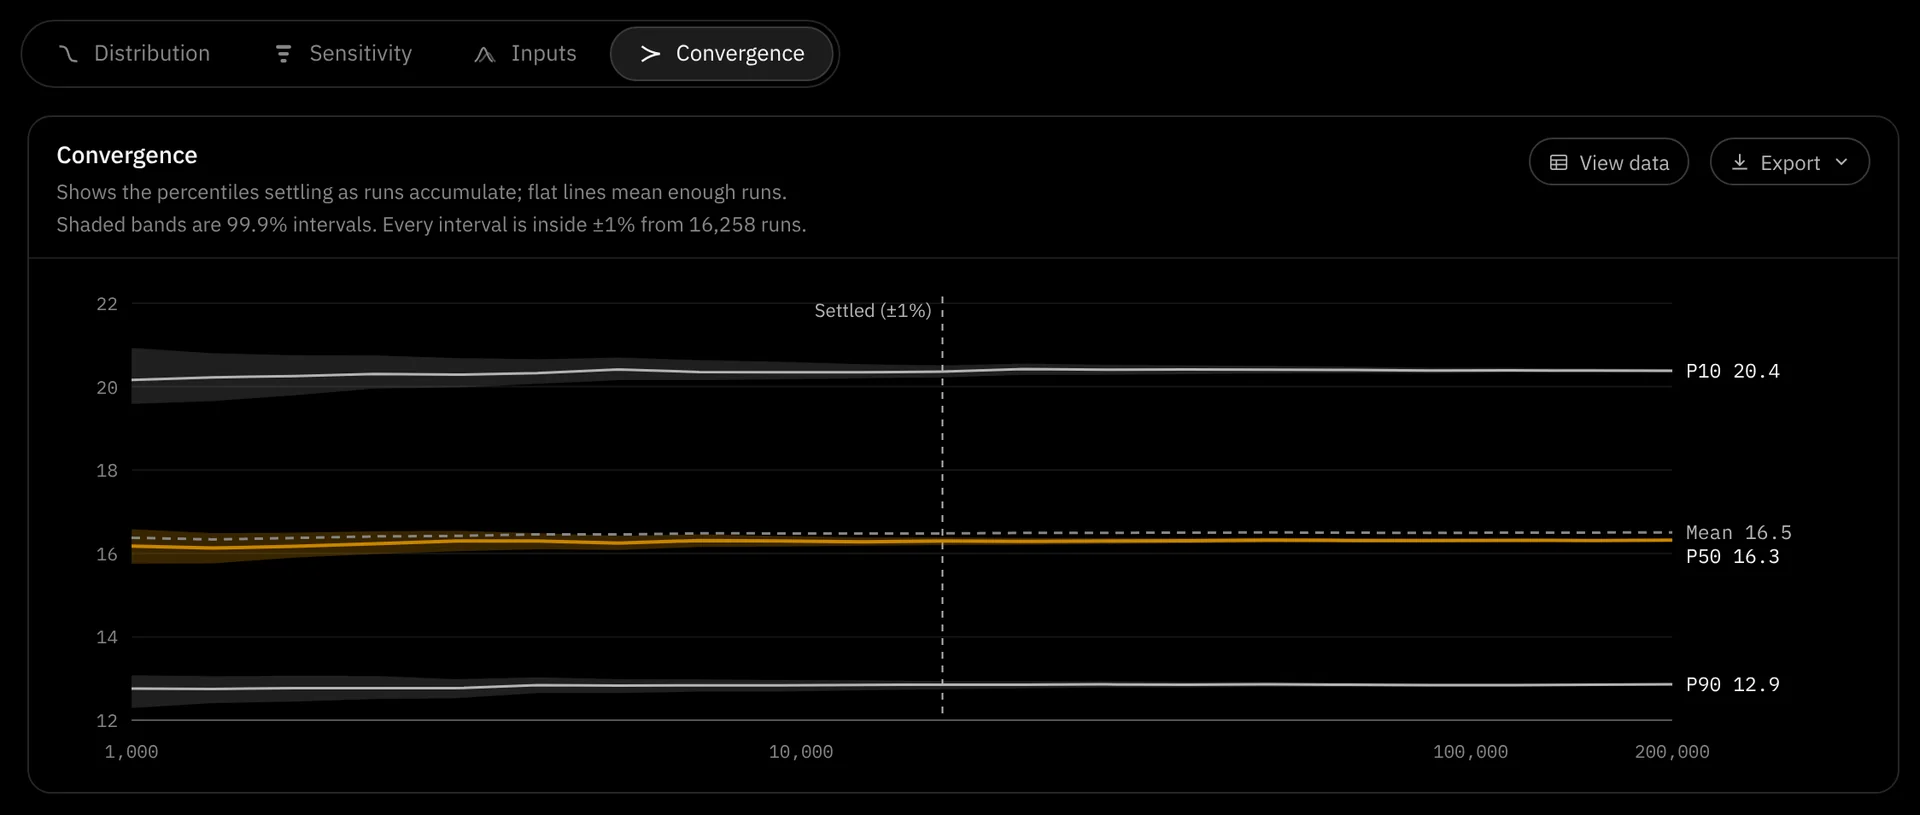
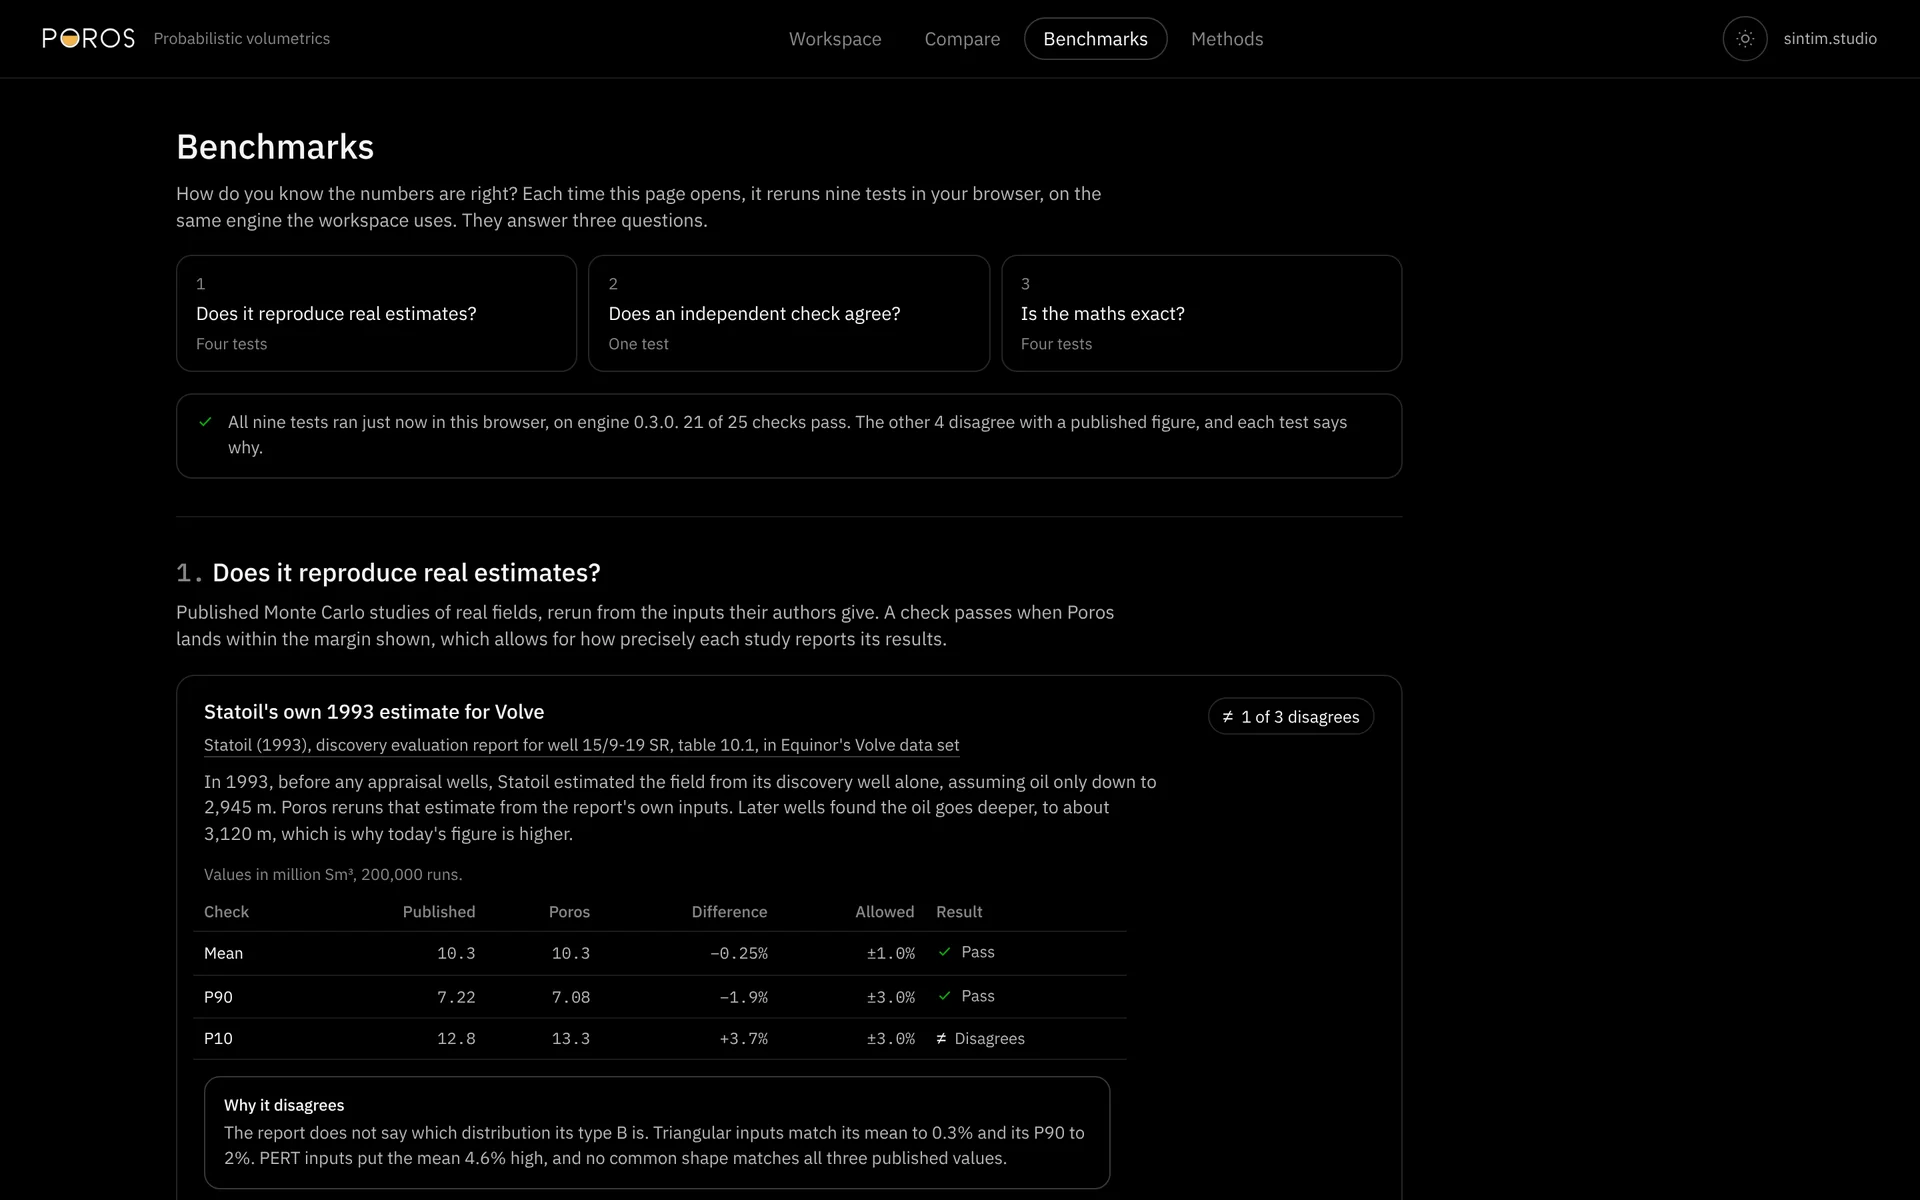
Every result carries a confidence interval, and Poros tells you when you've run enough for it to settle. The Benchmarks page reruns its tests in your browser each time it opens.
// 04
Compare and share
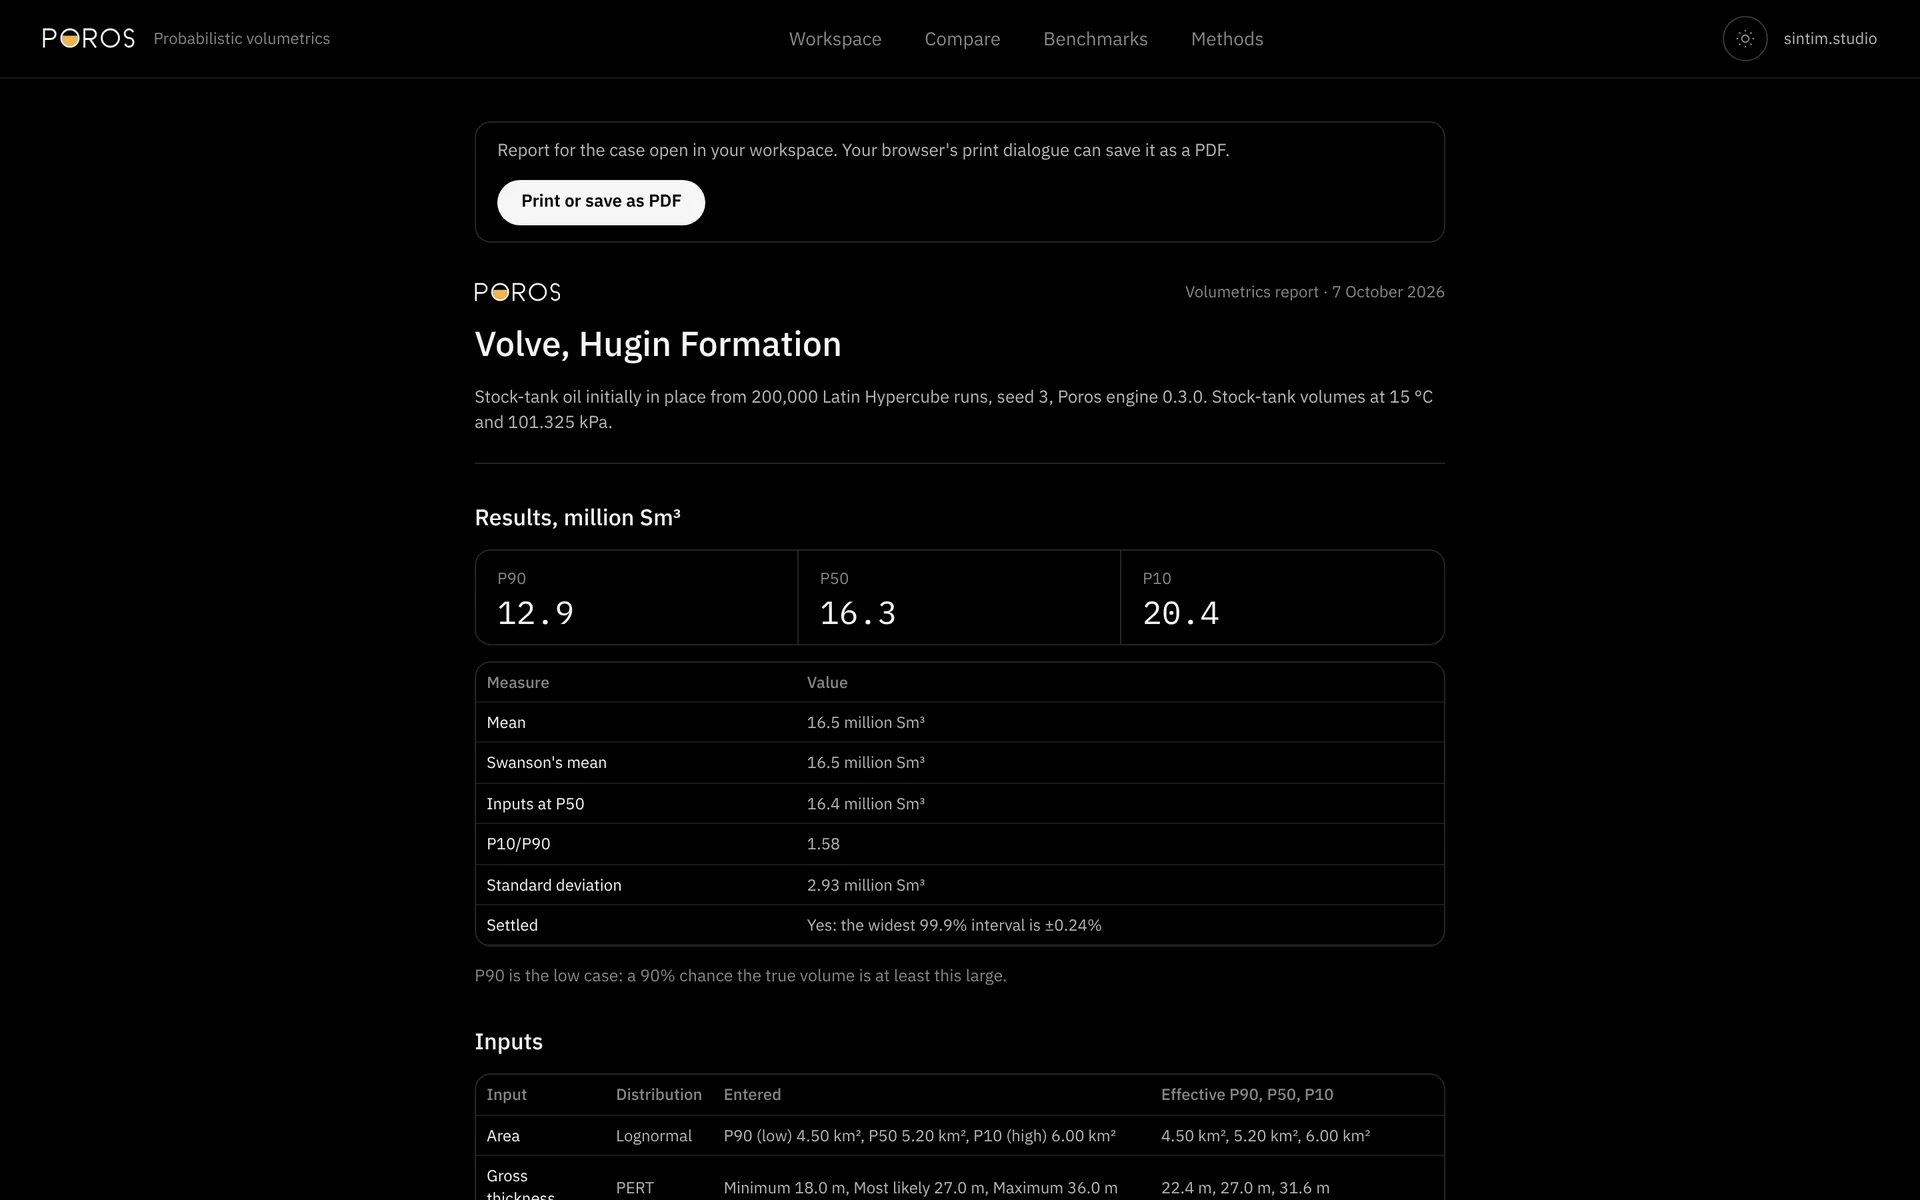
Up to four cases share one chart. A link carries the whole case, inputs and seed included, so the same browser engine gives the same numbers anywhere. Any case prints as an A4 report.
How it's checked
Checked against
the record.
Each time the Benchmarks page opens, it reruns Poros in your browser against three kinds of evidence.
Does it reproduce real estimates?
Statoil's own 1993 estimate for Volve, rerun from the report's inputs, comes back with the same average to within 0.3%.
Does an independent check agree?
A separate Python implementation of the same method gives the same low, middle and high cases to within 0.21%.
Is the maths exact?
Where the answer can be worked out by hand, Poros matches it to one part in a billion.
Where a published paper's own numbers don't add up, the test says so and shows why.
What 1993 teaches
Before Volve was appraised, Statoil's high case was 12.8 million Sm³, with oil assumed only down to the spill point. The official figure today is 18.7, because the oil went deeper. A simulation can only spread the uncertainty it is given. On today's inputs, the official figure sits inside Poros's range, towards its high end, and no input was tuned to put it there.
On a phone
Inputs in a drawer,
results up front.
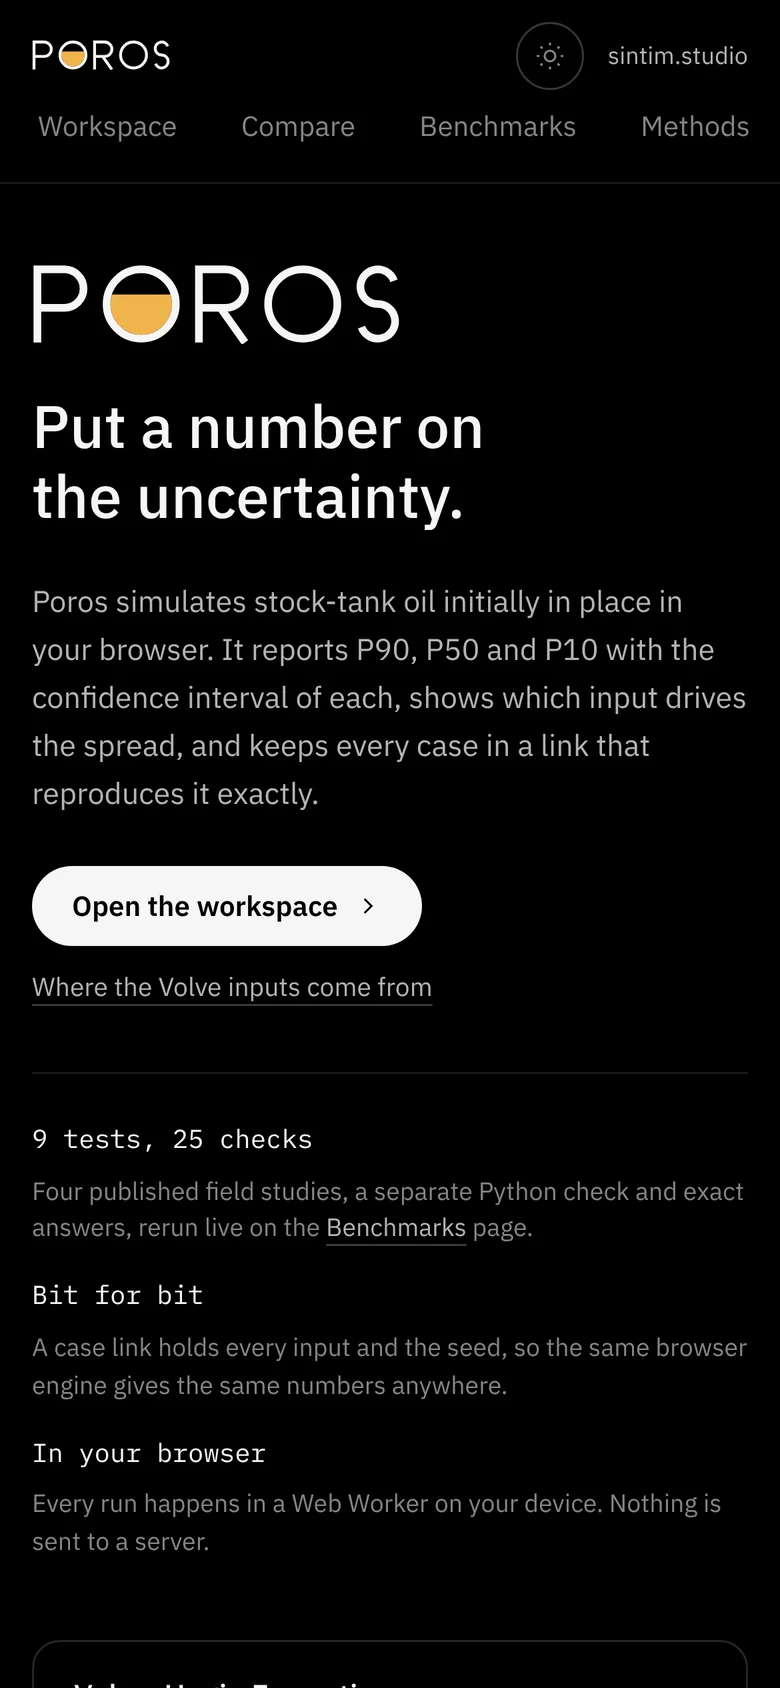
// front page
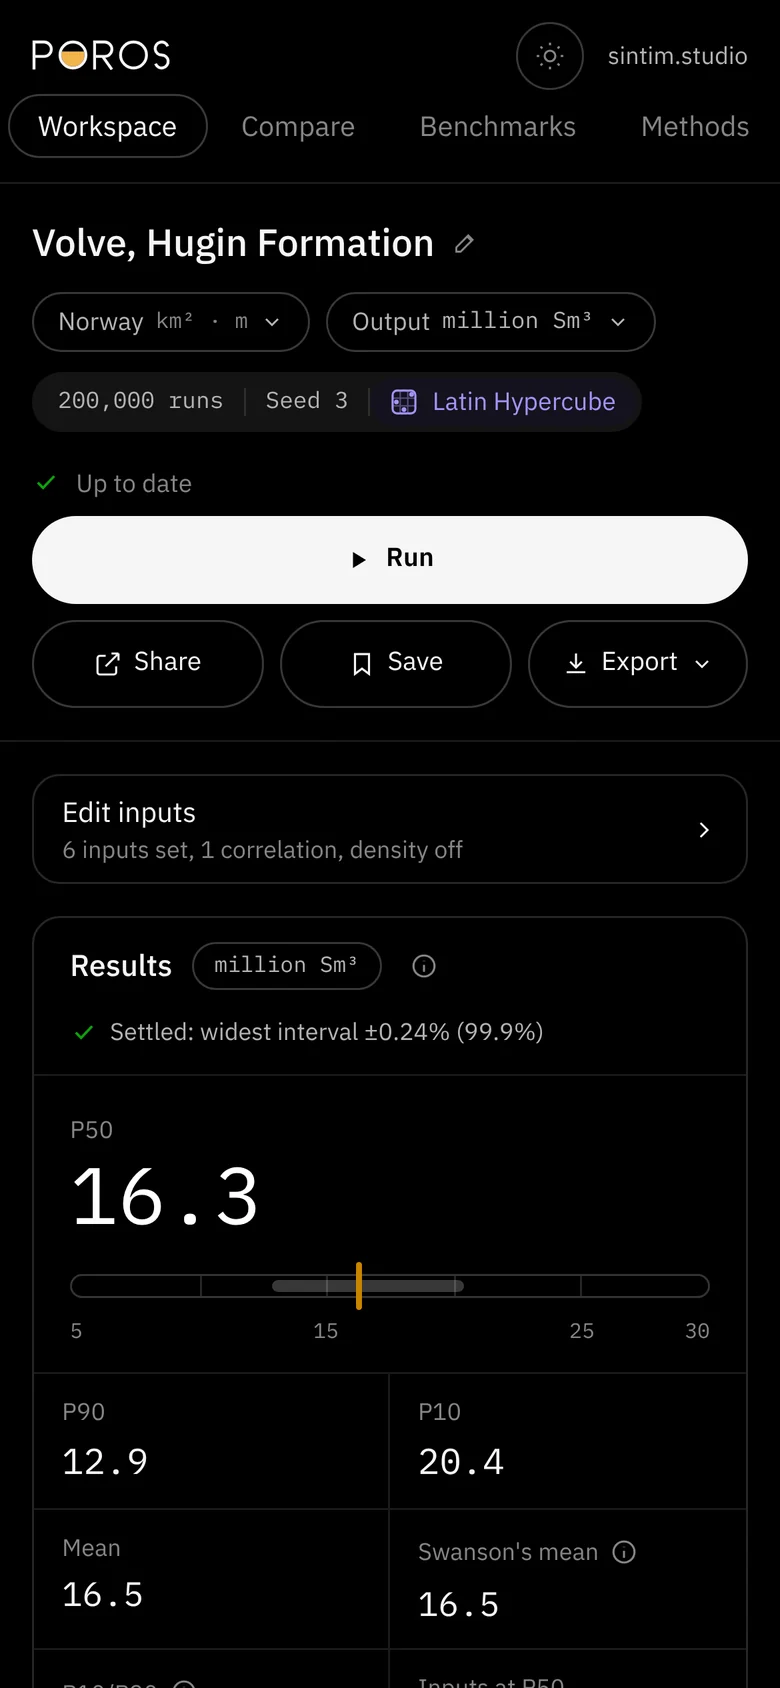
// results
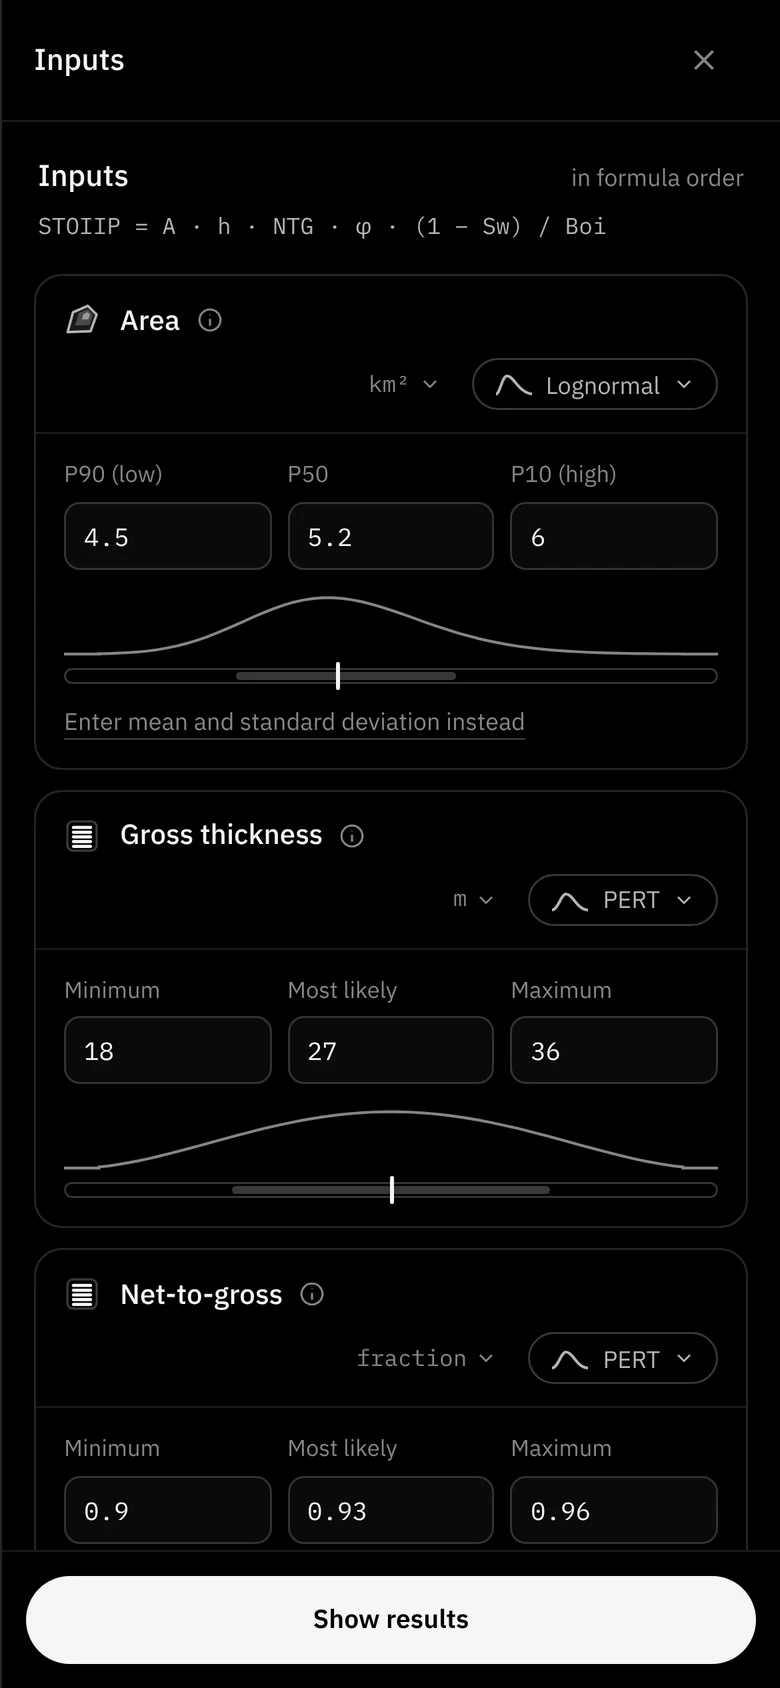
// inputs drawer
Open
Poros.
It opens on the Volve case. Change any input and the results update about 300 milliseconds later, for runs of up to 100,000.
Volve data: Equinor and the Volve licence partners, Equinor Open Data Licence